ASE Technology (ASX)·Q4 2025 Earnings Summary
ASE Technology Crushes Q4 as LEAP Services Hit $1.6B, Stock Jumps 2%
February 5, 2026 · by Fintool AI Agent
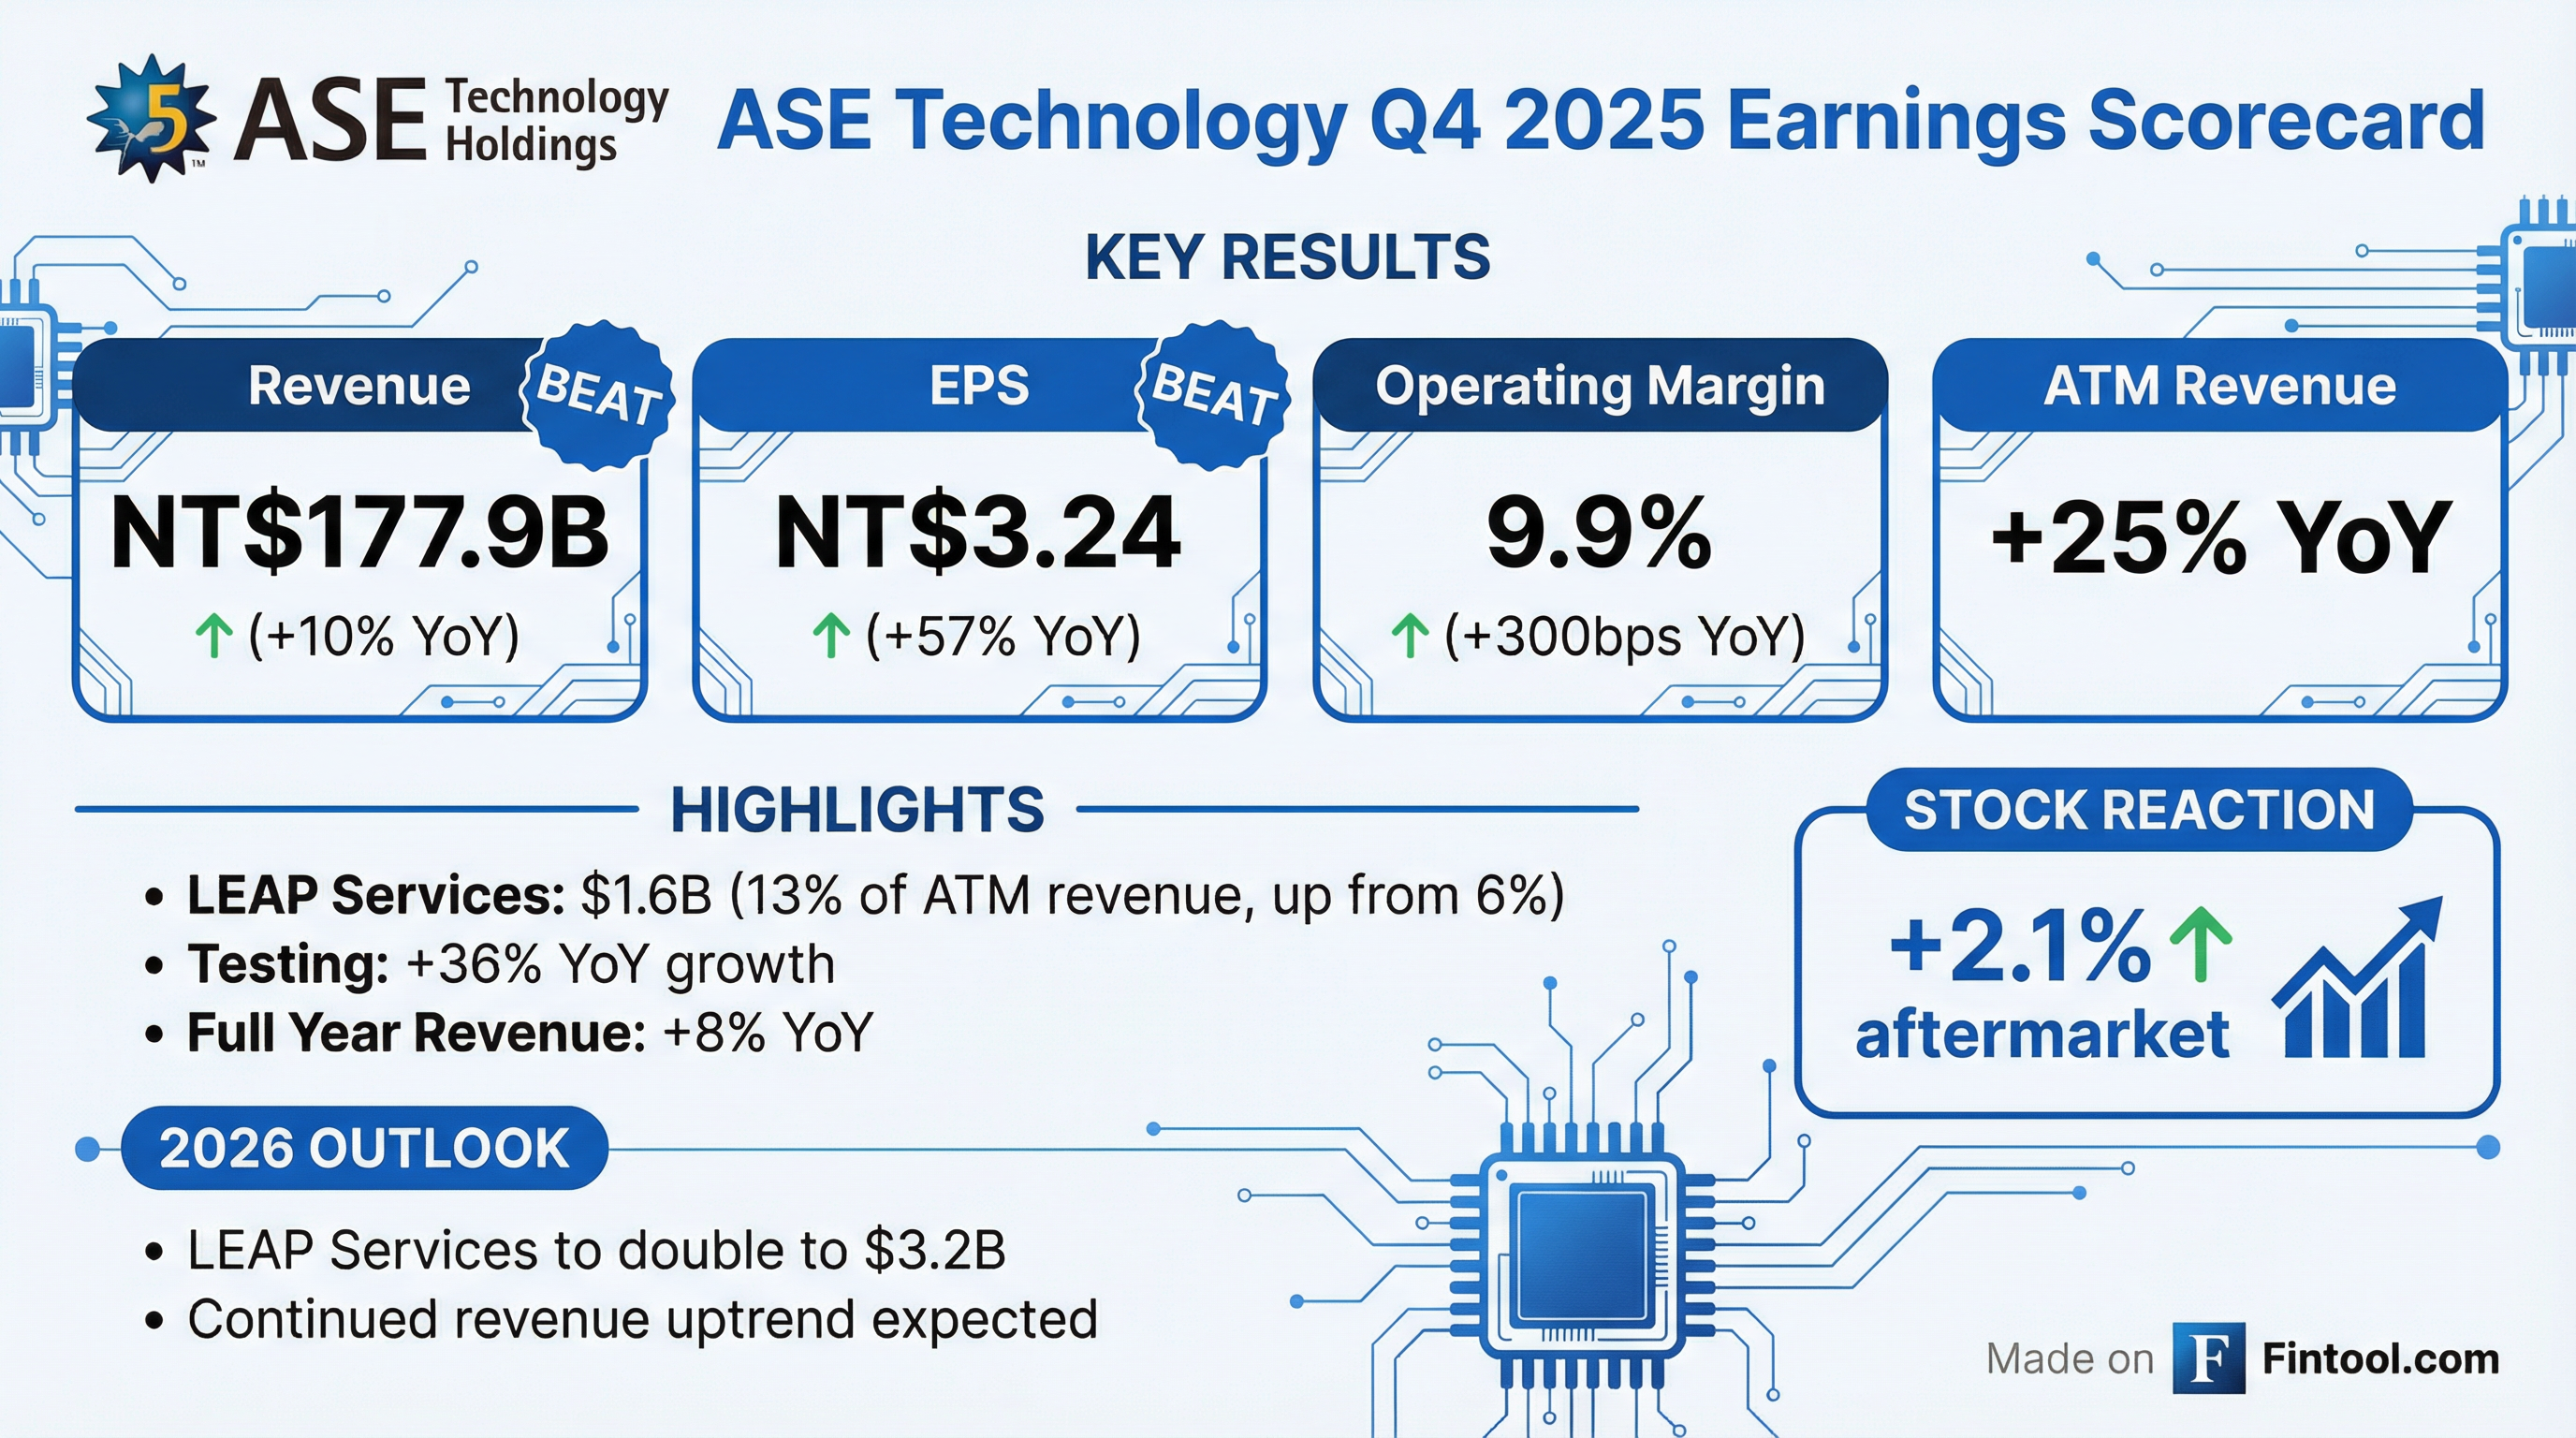
ASE Technology Holding (NYSE: ASX), the world's largest semiconductor packaging and testing company, delivered a blowout Q4 2025 with revenue and EPS beating expectations as AI-driven demand for advanced packaging services accelerated. The stock rose 2.1% in after-hours trading to $19.38.
Did ASE Technology Beat Earnings?
Yes — decisively. ASE beat on both revenue and EPS with significant margin expansion.
The beat was driven by explosive growth in LEAP (Leading-Edge Advanced Packaging) services and testing, both tied to AI semiconductor demand. Operating margin hit 9.9%, the highest level in recent quarters.
Full Year 2025 Performance:
What Changed From Last Quarter?
Margin Inflection: Gross margin jumped 240bps QoQ to 19.5%, the highest in 8 quarters. Operating margin improved 210bps to 9.9%. This was the breakout quarter where LEAP investments started paying off.
LEAP Scale Achieved: LEAP services reached $1.6B for FY 2025, now representing 13% of ATM revenue, up from 6% in 2024. The business more than doubled in one year.
Testing Momentum Continues: Testing revenue grew 33% YoY in Q4 and 36% for the full year, driven by AI chip test requirements including wafer-level and final test.
Capital Intensity Rising: Total machinery capex was $3.4B in FY 2025, with $2.1B in buildings/facilities/automation — primarily for LEAP and testing capacity.
How Did the Stock React?
ASX shares rose 2.1% in after-hours trading to $19.38 from the $18.99 close, reflecting investor enthusiasm for the margin expansion and 2026 guidance.
Stock Performance Context:
- YTD 2026: +12.6%
- 52-Week Range: $6.94 - $20.49
- Post-Q3 2025 Earnings (Oct 30): Stock at $15.04
- Post-Q2 2025 Earnings (Jul 31): Stock at $9.50
The stock has nearly doubled since July 2025, driven by accelerating AI packaging demand and improving margins.
What Did Management Guide?
ASE provided bullish 2026 guidance centered on LEAP doubling:
Q1 2026 Guidance (NT$ terms, 31.4 NT$/USD assumed):
Full Year 2026 Outlook:
2026 CapEx Guidance:
Key Management Commentary:
"Expect revenue uptrend to continue into 2026 and beyond, driven by leading-edge solutions and broad-based semiconductor demand related to AI proliferation and general market recovery."
"We will remain aggressive in CapEx spending to support the strong business prospects for 2026 and beyond, and to further extend our lead over competition."
Segment Deep Dive
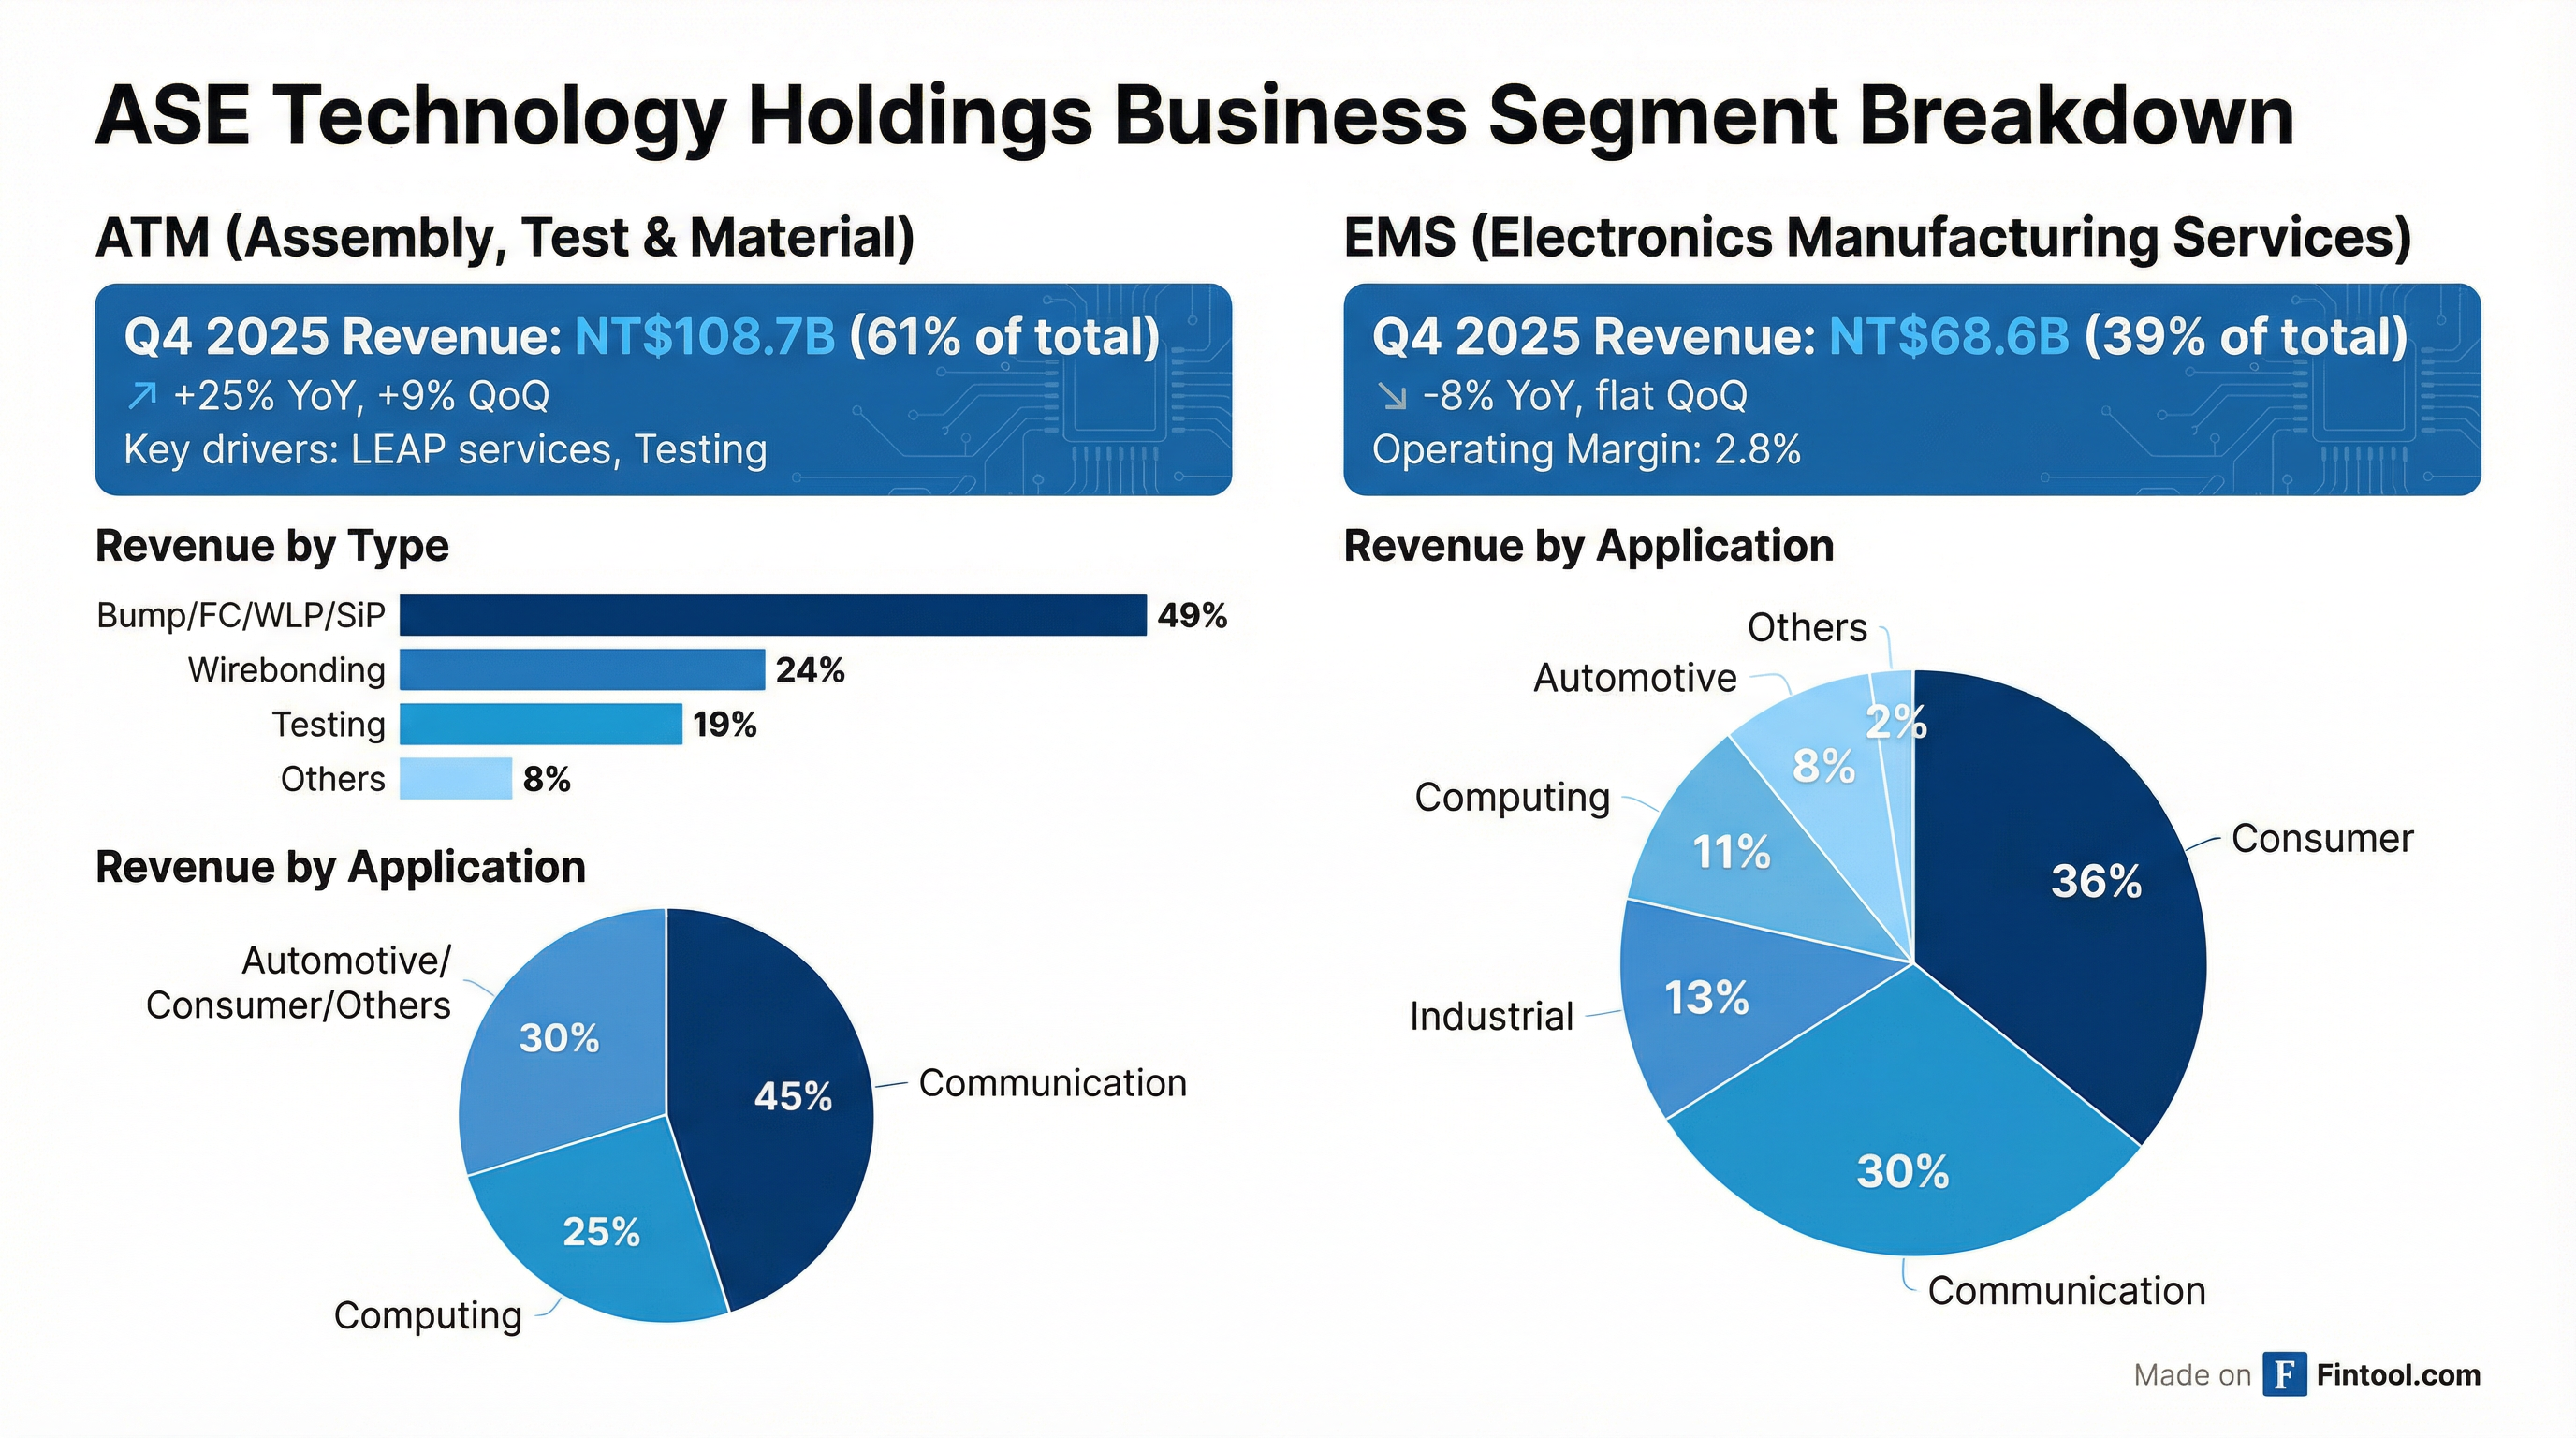
ATM (Assembly, Test & Material) — The Growth Engine
ATM delivered exceptional results with broad-based strength:
Revenue by Service Type (Q4 2025):
- Bump/FC/WLP/SiP: 49% (up from 47% in Q4 2024)
- Wirebonding: 24% (down from 27%)
- Testing: 19% (up from 18%)
- Others: 8%
Revenue by Application (Q4 2025):
- Communication: 45%
- Computing: 25% (up from 17% YoY — AI-driven)
- Automotive, Consumer & Others: 30%
The shift toward computing reflects accelerating AI demand, while communication remains the largest end market.
EMS (Electronics Manufacturing Services) — Stable but Soft
EMS continues to face headwinds from consumer electronics weakness:
EMS Application Mix (Q4 2025):
- Consumer: 36%
- Communication: 30%
- Industrial: 13%
- Computing: 11%
- Automotive: 8%
Balance Sheet & Cash Flow
ASE's balance sheet remains healthy despite elevated capex:
CapEx vs EBITDA (USD):
Capex intensity has been declining as investments scale, with Q4 showing the best ratio of the year at 59%.
Q&A Highlights
The earnings call Q&A provided additional color on strategy, competition, and execution:
On LEAP Breakdown and Upside
"The actual demand is far beyond the capacity we're capable of building... If we have any good news, you'll be the first one to know." — Dr. Tien Wu
- LEAP predominantly still OSAT (bump, flip chip) with wafer sort testing
- Full process revenue expected to triple to 10% of LEAP by year-end
- Final test to reach ~10% of test business by later 2026
- Multiple customer engagements on full process, meaningful revenue by late 2026
On Full Process Competition with Foundry Partners
"We're not competing... Customers and partners would like to have second source. There will be technology sharing, not on the OSAT, but also on the full process." — Dr. Tien Wu
- Full process is collaborative, not competitive with foundry partners
- Configuration complexity (HBM, TPU size, wafer vs panel) requires partnership
- 90% of future AI applications haven't been defined yet — opportunity remains massive
On Taiwan Plus One Strategy
"For wafers not produced in Taiwan, ASE is building footprint primarily in Penang... second to Taiwan." — Dr. Tien Wu
- Penang: Main expansion hub for automotive, robotics — capturing wafers not made in Taiwan
- Factory acquisitions: Bought two factories from Infineon; ADI Penang acquisition closing Q2 2026
- Also building footprint in Korea and Philippines, but Penang is the priority
On Silicon Photonics / CPO
"The optical business is an important direction for the industry... We're working with our foundry partner and end customers trying to implement the silicon photonics part." — Dr. Tien Wu
- USI acquired EugenLight for optical engine components (CPO-related)
- CPO involves chip-level, package-level, and system-level integration
- ASE developing "toolboxes" for various configurations — no single approach will win
- Taiwan cluster advantage: chip, CPO substrate, and system expertise all local
On EMS Strategic Pivot
"As the electronics industry pivots towards various applications of AI, so will the focus of our EMS business."
- Shifting from consumer SiP toward AI/AI-adjacent applications
- Focus areas: server, optical, power solutions
- Multiple EMS projects in development for growth this year and beyond
On CapEx Discipline
"CapEx dollar and capacity are not the best entry barrier, but it is an entry barrier." — Dr. Tien Wu
- CapEx is a leading indicator — if margins improve with CapEx, it validates strategy
- Management taking "one year at a time" approach, will calibrate as visibility improves
- Leading-edge investments are margin and return accretive — ROE and ROIC improving
- Healthy financial condition with multiple cost-effective funding sources
Forward Catalysts & Risks
Catalysts
- LEAP Doubling in 2026: $1.6B → $3.2B target with upside potential if capacity permits — demand exceeds supply
- Full Process Expansion: Triple full process revenue to 10% of LEAP, with technology sharing from foundry partners
- Silicon Photonics/CPO: Early positioning in next-gen optical interconnects through USI's EugenLight acquisition
- Margin Expansion: Q4 exit rate (26.3% ATM GM) with guidance for every quarter improvement in 2026
- General Market Recovery: Mainstream demand recovering with "friendly pricing environment"
Risks
- Currency Volatility: Strong TWD appreciation pressures margins (Q1 assumption: 31.4 NT$/USD)
- Execution on CapEx: ~$7B total spend in 2026 ($4.9B machinery + $2.1B facilities) requires continued demand
- Customer Concentration: LEAP services tied to key AI chip customers, though multiple engagements cited
- Taiwan Plus One Execution: Penang and other expansions need to capture non-Taiwan wafer demand
What Changed From Prior Outlook?
Management has consistently under-promised and over-delivered on LEAP and testing growth while maintaining discipline on margins.
Key Takeaways
- AI Packaging Inflection is Here: LEAP services doubled to $1.6B and are set to double again to at least $3.2B in 2026 — demand exceeds capacity
- Margin Breakthrough: Q4 ATM gross margin hit 26.3%, with guidance for every quarter improvement in 2026 toward upper end of structural range
- Full Process is Next: Triple full process revenue to 10% of LEAP by year-end, with technology sharing from foundry partners
- CapEx Accelerating: ~$4.9B in machinery + $2.1B in facilities planned for 2026, with 2/3 of machinery for leading-edge
- Strategic Diversification: Taiwan Plus One (Penang focus), CPO/silicon photonics positioning, EMS pivot to AI-adjacent
- Q1 2026 Better Than Seasonal: Revenue to decline only 5-7% QoQ (vs normal seasonality), ATM margins stay in structural range
Data sourced from ASE Technology Q4 2025 earnings call transcript and S&P Global.